A successful tour operator not only knows how to get tourists to come, but also knows how they act online. (it is a must at least in this digital world).
Visualize booking funnel with Google analytics to track and evaluate the booking process for your tourist business, so you can gain insights into how your consumers use Google and their overall experience with your excursions.
This is where Google Analytics comes in. Learn how to use Google Analytics to track and see the booking funnel in action.
It’s a great way to see and understand how the booking funnel works. With Google Analytics, you can see how the process leads to a goal or conversion.
In this post, we will show you how to use Google Analytics to see your booking funnel. Once you master this, you can optimize the poor funnel stage and boost your conversion rates.
Setting up Visualize Booking Funnel With Google Analytics
You may use the funnel report to find out how many visitors move on to the next step and where they stop converting.
Once, a funnel was made, and now tour operators may find the weakest step to observe where customers give up on booking. (drop-offs). Then, they can take actions to fix problems so that your conversion rate goes up.
So, let’s get to it. Let’s set up a booking funnel straight immediately in Google Analytics.
Step 1: Identify the key steps in the booking process and create goals for each step
To get started, clearly define the key steps in your travel agency’s booking process. Then, go to analytics.google.com and log in.
- Go to the Admin tab in the Google Analytics dashboard
- On the Create View part, choose Goals.
Step 2: Configure the goals in Google Analytics, including the destination and funnel steps
After you’ve set a goal, we’ll start the configuring step.
Here, you need to either choose an appropriate goal template or specify the goal with user-defined criteria. When setting the goal, we select “Custom” in order to display all available choices, whatever of the template. However, you can also pick an appropriate template directly.
1. Under Goal set-up, you will have some options for the type of goal. Let’s go with Custom!
2. Fill in the Goal description
a. Goal name: A distinctive identifier used to pinpoint the goal in a Google Analytics account. (Example: “Tour Catalog”, “View Booking Cart”, “Payment”, etc)
b. Goal ID: It acts as a repository for all information in regard to the specified goal. Goal ID will be determined by Google Analytics; therefore, we suggest sticking with it. Changes might result in additional goals listed on your website being replaced.
c. Goal type: This can be chosen depending on the company’s use case and information requirements.
You should select the “Destination” type and click “Continue” to put up a funnel visualization report.
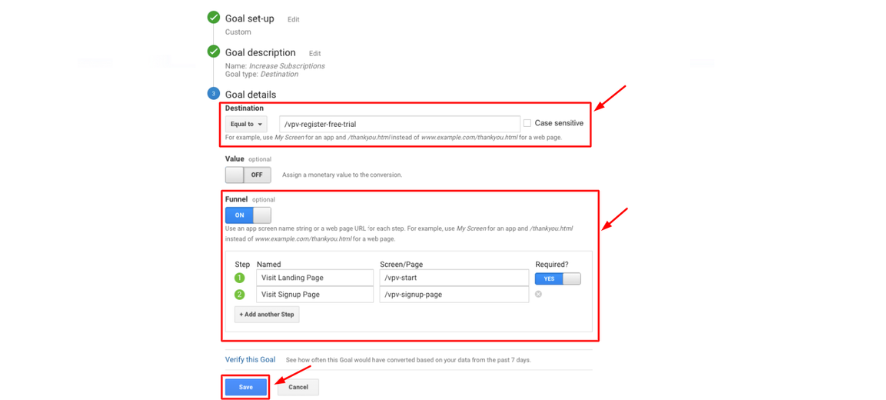
3. Fill in the Goal details
After giving a goal description, you can now specify the goal. The following requirements are necessary for a goal definition:
a. Destination: The target page’s definition. In the “Goal Details” box, you should define this page by providing its URL.
b. Funnel: When you want to create a goal funnel visualization, switch it on
You must now add the various steps of the funnel where user activity will be tracked under the funnel section. For each step, the parameters for Name and Screen/Page must be given. Depending on the needs, users can expand the phases with additional steps.
Once all the steps are in place, select Verify Goal. During the past seven days, Google Analytics will analyze your data to estimate the conversion rate for your booking funnel.
Click Save after entering all the necessary details for the Goal Funnel Visualization. As soon as a user interacts with the designated pages, the goal will be responsive.
Step 3: Utilize event tracking to capture additional information about the booking process
Simply go into your Google Analytics account, navigate to the left sidebar, and choose Conversions > Goals > Funnel Visualization to see your booking funnel. Now, you’ll be able to monitor where customers leave the booking process as well as how many customers see a booking through to completion.
Interpreting and analyzing the booking funnel data
We can get to the exciting part of the process—analyzing and interpreting the funnels—once you have done setting up your funnel visualization reports in Google Analytics.
Use the visualization tools in Google Analytics to see the flow of users through the booking process
Visualization tools can help you find out if new data are coming in or if there are new visitors to your web tour. This could be where the most important booking funnel data is kept.
At the top level of the funnel, there is a lot to gain as many visitors are still potential buyers. Still, a lot of visitors end up in the first or second stage of the funnel by accident, which makes it less likely that they will convert.
A unique pageview is the number of times a page is visited in a single session. This means that even if the same page is seen many times by the same user during the same online session, the unique pageview will still be 1.
In the opposite situation, the number of page views is 4 if a user accesses a website four times in one session.
Also, unique page visits don’t show how many users there are. The number of unique page views is not the same as the number of users. A single user can go to the same page numerous times in separate sessions, which means that the page has been seen by many distinct people.
Identify bottlenecks and points of a drop-off in the funnel
A funnel drop is when a user leaves a conversion process. That means you miss a potential customer, which results in revenue loss.
With funnels, you can see where visitors move and leave in the process of converting or booking. You can find and get rid of bottlenecks in your booking process to boost your online sales.
With Google Analytics, you can track the funnel drop-off rates. You can learn more about how your visitors get to your site, which will help you improve your sales and marketing funnels.
You can review and analyse the data in the GA conversion report to see which pages are working well and which are not. You may also make changes to your funnel to make sure it sends people in the right route.
The Conversion Tunnel can be accessed in two steps:
- Conversions > Goals > Open funnel illustration
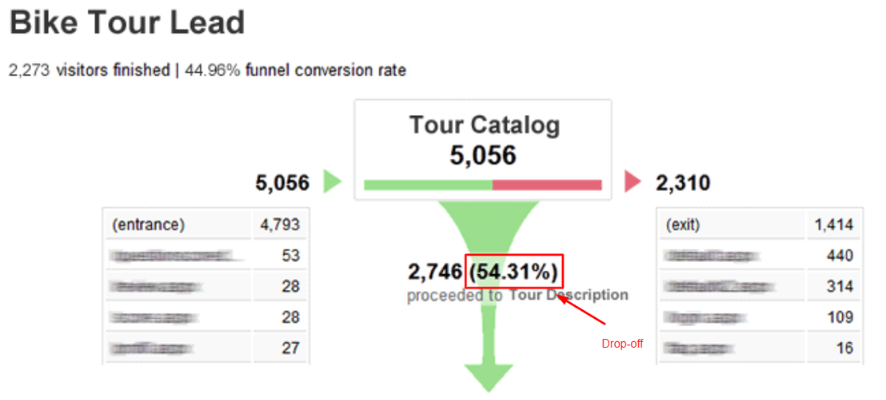
- Funnel appears. We have highlighted specific features in the below image, which we will explain more below.
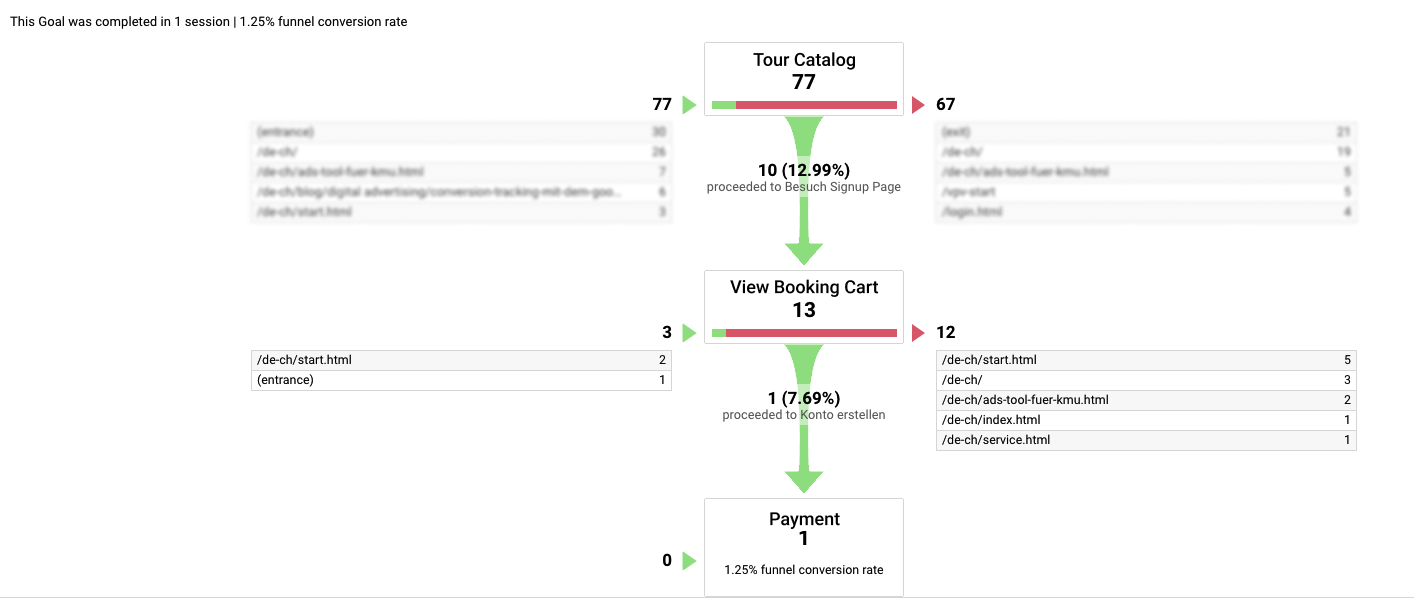
The micro-conversion funnel reveals the following insights:
- Entry-Site: This is the page from which a user enters the conversion funnel.
- Bounce-Site: at each tunnel turn.
- Bounce-Rate: each funnel step.
You can now review your own booking processes and make any required improvements based on the funnel data.
Use segmentation to understand the behavior of different groups of users
The data of the funnel can also vary by segment, such as gender, event, device type, area, and so on.
You can simply identify specific sessions and other types of data in Google Analytics thanks to its advanced segmentation and filtering tools.
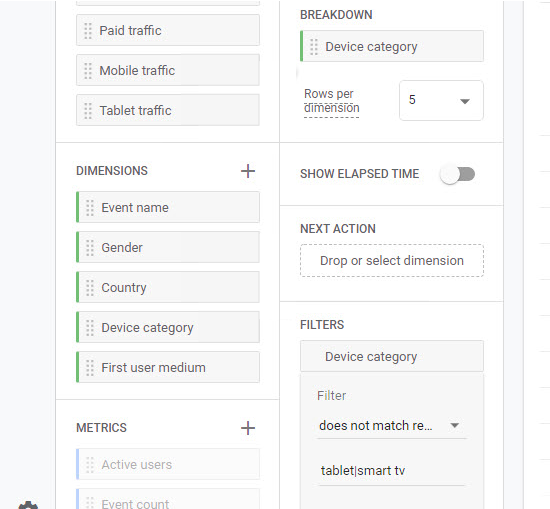
And here are the results of the final three checkout stages:
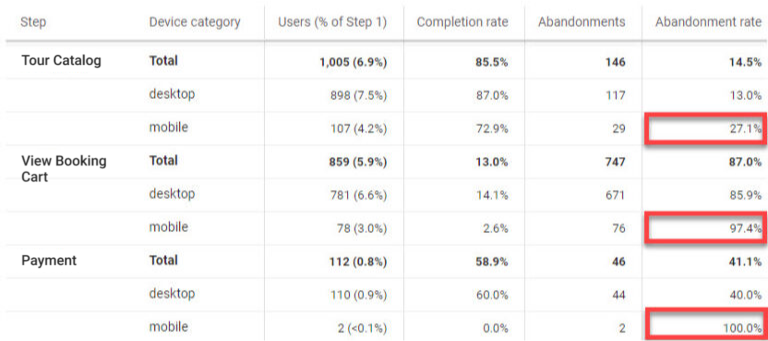
As compared to desktop, mobile has a far greater exit rate. Therefore device-specific testing makes sense.
Using the booking funnel data to improve the booking process
With the data of the booking funnel, you now can leverage it to make some necessary improvements to your tour website. These are 3 actions to do so:
Identify areas for improvement based on the data and user feedback
The primary purpose of funnels is to give you insight into the behavior of visitors at each phase of the conversion process. This tells you which improvements you need to do to optimize your tour sell website.
Funnel reports are very important since they give you the exact point at which people start dropping off and abandoning the website.
For instance, if the funnel report reveals that people abandon the website at the Tour Catalog step, it could indicate that your tour image may not be really attractive. If that is the case, then you should immediately redesign that page.
A/B test changes to the booking process to see the impact on conversion rates
How can we boost the funnel completion rate if you see the completion rate percentage is substantially lower than the dropoff percentage on the signup page?
More than 50% is an excellent percentage. Here, you can use Google Optimize to test your hypothesis, make an A/B test for the signup page, and check the customized funnels again to see how the test is going.
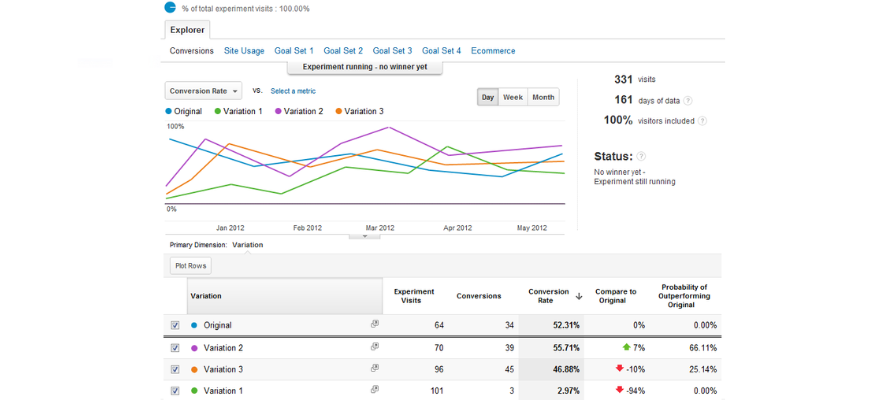
If the completion rate percentage improves, congratulations!! You just did it. If not, don’t worry; try another hypothesis!
For each A/B test applied to the booking process, you will receive different conversion rates from which to make appropriate improvements for each case.
Monitor the performance of the booking funnel over time to track the effectiveness of the improvements
Lastly, once you’ve done everything you can to improve a certain part of your booking process, it’s time to keep an eye on it and make changes as needed.
Google Analytics helps you to track the effectiveness of improvements by recording and comparing the performance of past and present booking procedures to give an overall assessment.
It should be noted, however, that the processing lag in Google Analytics ranges between 24 and 48 hours. It should be noted, however, that the processing lag in Google Analytics ranges between 24 and 48 hours. This means that at this time, conversions or even radio data may need to be recognized or shown correctly.
Also, you shouldn’t choose time frames that are too short because you won’t be able to look at the data, which will make it hard to make accurate assessments of past and present improvements.
Best practices for using Google Analytics to track the booking funnel
Ensure that the tracking is set up correctly and accurately reflects the booking process
To get the tracking in funnel visualization reports to go in the proper direction, you must first grasp how they function. Improper funnels can generate numerous problems, and your conversion rates will not improve.
Funnels should be used only if you have a well-defined step-by-step booking process for your customers to follow to achieve the purpose of your website.
Second, always provide the right data when creating the funnel page. You should only utilize the Request URL when creating your funnel page. This is what follows the domain name.
Regularly review and update the goals and funnel steps as needed
Once you’ve completed creating your funnels, be sure to try them out first. Next, continually assess the goals and funnel stages and make any necessary updates.
You will don’t want to end up with a bunch of data but do not know where to improve.
To remain updated with the funnel trend and customer behavior, track the funnel and export the data frequently.
Utilize other tools and resources
You may know that tackling Google Analytics funnels has certain limits. For example, you can only identify where people drop off without knowing why. This makes it difficult to determine the issues affecting your conversion rates and how to address them.
At this stage, don’t be afraid to use other tools and resources, like heatmaps and user testing, to gain further insights into the booking process.
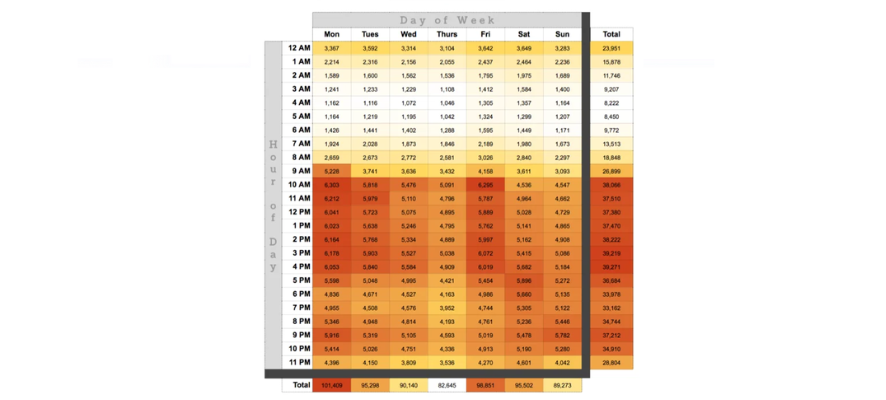
Google Analytics Heatmap is a graphical representation of the data on your website. It allows you to observe how visitors engage with your website, such as which pages they click on and which parts of your page they like.
Google Analytics Testing enables you to track the performance of various parts of your website. It enables the user to track each step the user takes while viewing the page.
At TRAVELER – Gain valuable insights into the booking behaviors of modern travelers with the power of a WordPress theme designed specifically for online travel bookings! As more and more travelers turn to online platforms to book their tours, hotels, and activities, it’s crucial to understand their booking preferences and behaviors. With our friendly and user-friendly booking online travel theme for WordPress, you can easily track and analyze how travelers interact with your website, making data-driven decisions to optimize their booking experience.
Don’t miss out on the opportunity to enhance your online travel business with this powerful and intuitive WordPress theme! Let’s embark on this exciting journey of understanding and optimizing traveler booking behaviors together!
Conclusion
A bit long, isn’t it? But this guide will give you an advanced understanding of how to visualize your booking funnel with Google Analytics.
Since travelers are more likely to book their tours, hotel, and other activities online, it is critical to understand their booking behaviors.
As a result, you can put in the necessary improvements to develop a frictionless booking path for your potential tourist, leading to more direct bookings as the year comes to a close.

